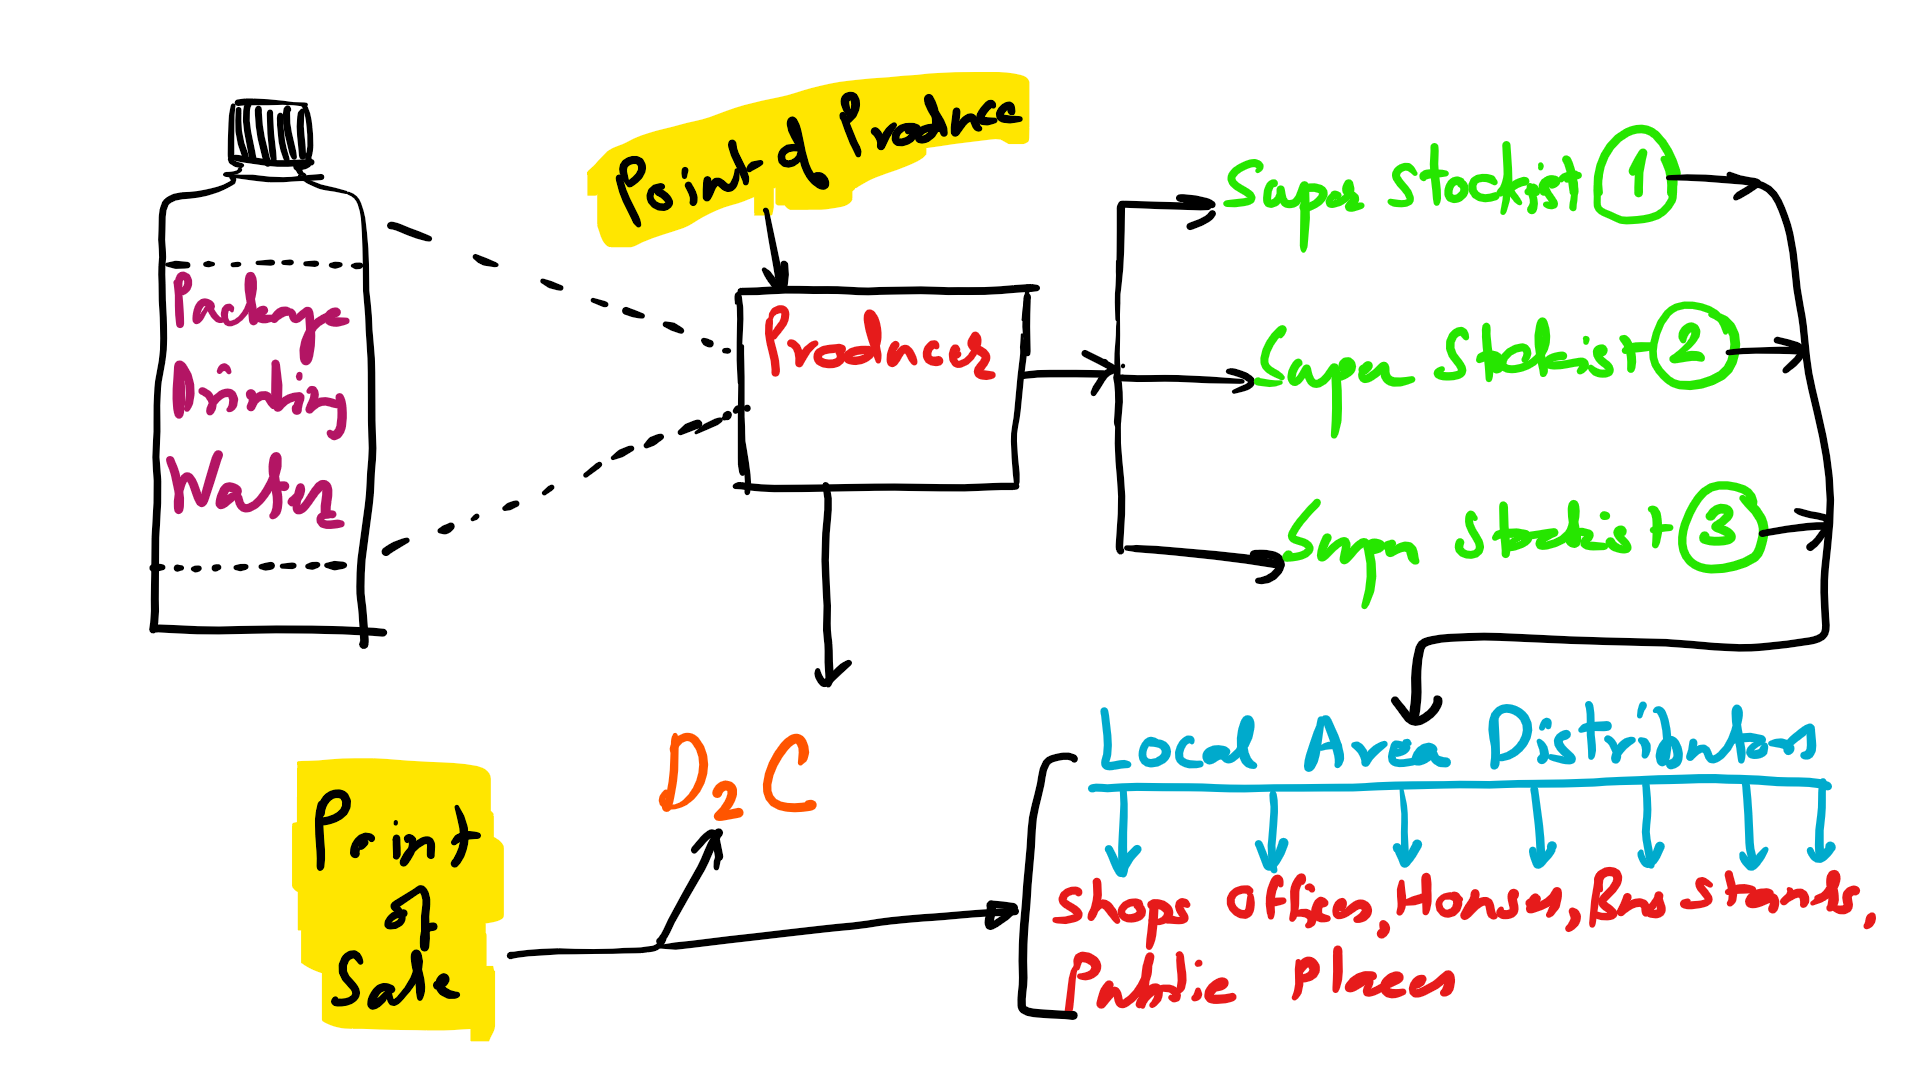
Categories
Mineral Water Business Mineral Water Business Profit

Is Mineral Water Business Still Profitable in 2026? (The FSSAI “High-Risk” Reality Check)

Yes, This Business is Still Profitable in 2026 also !

Table of Contents

Defining the Product: Why “Packaged Drinking Water” is the 2026 Gold Mine

Most people use the term “Mineral Water Plant,” but technically, we are almost always talking about Packaged Drinking Water.

In 2026, understanding this distinction is the difference between a failing amateur and a profitable professional:

  • Packaged Drinking Water (The Volume Play): This is produced from any groundwater source. We use the Reverse Osmosis (RO) method to strip dissolved minerals and then scientifically re-balance them for taste and health. This is the standardized scalable model most plants in India follow.
  • Natural Mineral Water (The Niche Play): This is rare, location-specific water that is balanced at the source itself. The costs, source-water protection, and FSSAI regulations for these are entirely different from standard plants.
    Strategic Resource: If you are specifically looking to bottle water directly from a natural protected source without RO, read our deep dive here: What is Packaged Natural Mineral Water Actually?.

The 2026 Strategic Shift

While the bottling and packaging methods remain similar, the regulatory environment has changed ( From BIS to FSSAI High-Risk Category ). As an investor, you aren’t just selling “water”; you are selling Certified Safety.

Expert Insight: In 2018, having a standard RO plant was sufficient. In 2026, your profitability is strictly indexed to your FSSAI High-Risk Compliance. If your plant architecture lacks Sanitary Design principles—such as CIP (Clean-in-Place) compatibility, microbial-resistant surfaces, and automated batch-traceability—your “profit” will be liquidated by compliance penalties and high frequency of sanitation downtime.

Profitability for the Plant Owner: Why MRP is a Mirage

One of the most dangerous mistakes a new investor can make is calculating ROI based on the Maximum Retail Price (MRP). While the consumer pays Rs. 20 (or Rs. 18 post-GST adjustment) for a 1-liter bottle, that figure is mathematically irrelevant to your manufacturing profit.

To understand your real margins in 2026, you must look at the Ex-Factory Price—the price at which you sell to your distribution network.

The 2026 Distribution Reality

Your profitability is distributed across a multi-tier channel:

  • Super Stockist: Usually handles an entire city; they buy at the lowest price point directly from you.
  • Distributors: Appointed by stockists to cover specific zones.
  • Retailers: The final point of sale (hotels, shops, malls) that realizes the highest margin per unit.

Technocrat Note: As a producer, you often earn the least per bottle compared to the retailer. Your profit is a function of Volume and Operational Efficiency, not the retail price tag.

Increased Capital & Operational Pressure

The 2026 landscape has shifted the financial “Breakeven Point” (BEP) due to two primary factors:

  1. Capex Inflation: To stay competitive and compliant with the “High-Risk” FSSAI mandate, plants now require higher-capacity, automated machinery to lower the per-bottle labor and utility cost.
  2. Opex Sophistication: Tight monitoring of “Money Leakages” is now mandatory. Winners in this space are implementing ERP systems and Real-time Monitoring to maintain margins while MRP remains stagnant.

High Margin Revenue Streams for 2026

Co-Packing & White Labeling: Producing for the HORECA segment ( Hotels, Restaurants & Cafes or other private brands who sell under their own name. This allows you to utilize your plant’s full capacity without the marketing overhead of a new brand.

Check the Playlist below

B2G (Business to Government): The Institutional Profit Model

While most entrepreneurs focus on the crowded retail market, the most stable profits in 2026 lie in Government Partnerships (B2G). Partnering with state entities like MSRTC allows a local plant to shift from “selling” to “supplying,” ensuring 100% machinery utilization and guaranteed monthly volumes.

Key Highlights of the B2G Segment:

  • Massive Volume: Move lakhs of bottles through established networks (Railways, Transport, Tourism) without individual marketing costs.
  • Brand Authority: Using a co-branded label (like the Nath-Jal model) grants your plant instant trust and a “Quality Shield” against local competitors.

Case Study: The Nath-Jal Blueprint Watch the video below to see how a Pune-based unit scaled through an MSRTC partnership. We cover the exact “how-to” of these institutional tie-ups in our [Advanced Training Program].

Glass Bottling: A premium, eco-friendly segment growing rapidly in the hospitality sector. This is the ultimate “Reliance-proof” model because it targets a segment that values sustainability over the lowest price.

Technical Preview ( Short )

Operational Efficiency: The 2026 Profit Multiplier

In the 2026 “High-Risk” regulatory environment, profit isn’t just about what you sell—it’s about what you don’t waste. With increased scrutiny from FSSAI, a single documentation gap or failed batch can wipe out your quarterly gains.

The “Zero-Leakage” Strategy To survive the price pressure from massive entrants like Reliance (Campa Sure) at Rs. 15 MRP, your plant must operate with surgical precision:

  • Real-Time Monitoring (IoT): Tracking electricity consumption and water rejection rates; an RO rejection higher than 30% is a direct hit to your bottom line.
  • Inventory & Batch Traceability: Automated systems for preforms and caps are now mandatory to prevent the 3–5% margin loss common in unorganized plants.
  • Labor Optimization: Transitioning from manual loading to semi-automated conveyors reduces breakage and lowers the “per-bottle” labor cost needed to compete in the current market.

Diversifying Your Revenue Streams

As discussed in the “High Margin Revenue Streams” section above, relying on a single brand or a passive distributor model is no longer a safe bet. To truly maximize the operational efficiency of your plant, you must utilize your capacity through specialized, high-margin models.

The 2026 Unit Economics: Can You Survive a ₹15 MRP?

To compete with massive entrants while maintaining a professional, “High-Risk” FSSAI-compliant facility, your unit economics must be surgical. Below is the 2026 Benchmark for a standard 1-liter bottle (19g preform) produced in a 2000 LPH plant.

The Cost-Per-Bottle Breakdown (1 Litre)

  • Raw Material & Consumables: ₹4.00 (Includes preform, cap, label, and shrink film).
  • Operational Overheads: ₹1.50 (Includes electricity, mandatory monthly lab testing, and FSMS compliance).
  • Total Cost of Manufacturing: ₹5.50 per bottle / ₹66 per case (12 bottles).

Technocrat Warning: If your current or planned plant exceeds ₹6.00 in manufacturing cost, you are at high risk of being priced out of the retail market by 2027. Success in 2026 is about Volume Efficiency and Money Monitoring.

5. The Final Verdict: Is it Still Profitable?

On the outset, the Mineral Water Business IS profitable because the demand for “Pure Water” is non-negotiable. However, in 2026, “demand” does not guarantee “profit.”

To make YOUR business profitable, you need to move beyond being a machinery operator and become a technical strategist who understands your Break-Even Point (BEP) and ROI.

The “Sincere Informer” Strategy for Success:

  • Achieve BEP within 12 months: This requires strict control over “invisible” expenses like machine downtime and water rejection.

What is a Break-Even-Point

  • Optimize the Product Mix: Do not ignore 20L Jars. They offer lower OpEx (no recurring preform costs) and direct margins that often exceed 30%.
  • Avoid “Least Price” Machinery: Choosing a supplier solely on the lowest quote is the #1 profit-drainer due to future downtime and compliance failure.

Where to Begin?

Why start by repeating the mistakes of failed entrepreneurs? Learn the Aqua-Finance Metrics from mentors with over 28 years of industrial experience.

  • Option A: Professional Training: Master the 2026 FSSAI “High-Risk” framework and learn how to innovate your distribution model.
  • Option B: Technical Consultancy: If you are ready to build, let us audit your technical specifications before you sign a machinery contract.

“Don’t build a plant based on a machinery quote. Build it based on a Profit Matrix.”

⚠️ Strategic Alert: The Death of the “Passive Producer” Model

In the previous decade, a plant owner could survive by simply appointing 5–10 distributors and focusing on production. In 2026, that model is a liability.

With the entry of conglomerates like Reliance—launching Campa Sure at a disruptive Rs. 15 MRP—the “middleman” margin is being squeezed to zero. If you rely solely on traditional distributors, you are competing on price against a giant with infinite “Economies of Scale.”

FAQs About Profitability

What is the average “Cost per Bottle” (Unit Economics) in 2026?

Basic Consideration
– standard 1 Ltr Bottle. Having 19 gms Weight
– 2000 LPH + 30 BPM Very Basic Plant
– Produces 700 Cases per Day ( BEP )
– Purchase + Consummables = Rs. 4 per Bottle
– Overheads = Rs. 1.5 per Bottle
– Cost of Mfg = Rs. 5.5/Bottle, Rs. 66 per Case
We discuss this in details in Training

How Long Does it take to achive BEP ?

Every Plant has a different BEP. The earlier you reach to the BEP the better profitability you can expect.
At the end of 1st year, you should be reaching the BEP, if you maintain a strict control over Expenses.

Which is more profitable : 20L Jars or 1L Bottles?

20-liter jars offer lower OpEx (no recurring preform and blowing costs), with net margins often exceeding 30%.
However, 1-liter bottles have a much larger market share and better brand visibility. A balanced “Product Mix” is often the most stable profitability strategy.
Word of Caution :- Many entrepreneurs totally neglect the Jar Vertical, and just talk about Bottles. Do not forget that 20 Ltr Jars offer you more “Direct” Customers, which reduce your sales expenses to a great extent & boost up your productivity.
– We have many success stories of entrepreneurs who started with just Jars, and now own a couple of factories.

What are the unknown Profit-Drainers ?

The most major of them is Machine Down Time. We have observed entrepreneurs just choose machinery from suppliers offering them Least Priced Equipment.

Categories
Mineral Water Business Profit

5 Strategic Steps to Evaluate Mineral Water Plant Profitability

Updated April 2026

Beyond the “Cost per Bottle” Myth

Many investors fall into the trap of calculating profit based solely on direct material costs. This surface-level view is why many units struggle. To understand true profitability, you must analyze the intersection of Operational Expenses (OPEX) and Market Dynamics.

The Key Difference: Profit margin isn’t just a number; it’s a result of five specific variables you must align before you start production.

Table of Contents

Why Identical Plants Yield Different Profits

To understand why generalizations fail, let’s compare two entrepreneurs, Ramesh and Suresh, both operating plants with the same machinery but different market strategies.

The Head-to-Head Comparison (Daily Sales)

MetricRamesh
Volume
Focus
Suresh
Value
Focus
1 Ltr Cases Sold800 Cases (12 bottles /case)500 Cases (12 bottles /case)
Selling Price (to Dist.)Rs. 80 / CaseRs. 90 / Case
20 Ltr Jars Sold200 Jars500 Jars
Selling Price (to Dist.)Rs. 40 / JarRs. 30 / Jar
Total Daily RevenueRs. 72,000Rs. 60,000

Critical Observations:

While Ramesh has a higher daily turnover (Rs. 72,000), his profit margin may actually be lower than Suresh’s. Why?

  • Higher Direct & Recurring Costs: Because Ramesh sells 800 cases of small bottles daily, his direct material cost (PET preforms, labels, caps) is massive. These bottles are “use-and-throw,” meaning he must repurchase raw materials every single day to stay in business.
  • The “Returnable” Advantage: Suresh sells fewer small bottles and focuses on 20 Ltr Jars. Unlike bottles, jars are returnable assets. Once the initial investment in the jar is made, the primary recurring expenses are simply the filling labor and the cap.
  • Interest & Working Capital: Ramesh requires a much larger “Working Capital” to keep buying thousands of preforms and labels. This often leads to higher interest expenses on credit lines or loans. Suresh, by using returnable jars, keeps his daily cash outflow lower and his interest burden manageable.
  • Market Sensitivity: If the price of PET resin goes up, Ramesh’s profit could vanish overnight. Suresh is protected from this because his “packaging” (the jar) is already sitting in his warehouse or with the customer.

Strategic “Balancing” Act :-

The Ramesh vs. Suresh example isn’t about choosing one over the other; it’s about Strategic SKU Planning. A successful plant owner must be flexible enough to tweak their product mix as market demands shift.

1. Small Bottles (The “Scale” Driver)

  • Purpose: These build your Brand Identity. When people see your 200ml or 1L bottles at events or in retail shops, they recognize your name.
  • Trade-off: High recurring costs and higher competition, but essential for market “presence.”

2. 20 Ltr Jars (The “Cash Flow” Driver)

  • Purpose: Ideal for Institutional Sales (Offices, Banks, Hospitals).
  • The Advantage: Beyond the lower material cost of returnable jars, your Client Servicing Cost is significantly lower. Delivering 50 jars to one corporate office is far more efficient than distributing 1,000 individual bottles to 50 different small retailers.

Expert Recommendation: Do not put all your eggs in one basket. Use small bottles to gain “Brand Scale” and 20 Ltr Jars to secure steady, low-overhead “Institutional Revenue.” Your profitability depends on how well you balance this portfolio.

The 5-Step Strategic Framework

Calculating profitability is not a one-time event; it is a continuous process of aligning your operational capacity with market reality. Based on my experience setting up and auditing plants across India and internationally, I have identified five critical pillars.

If you skip even one of these steps, you aren’t running a business—you are gambling with your capital.

Here are the 5 Strategic Steps you must evaluate to arrive at a realistic profit margin:

Step 1: Know Your Business Model (The “Vehicle”)

Before purchasing machinery or making any investment/s, you must decide on your operational structure.When we say “Vehicle”; it points to which are the major revenue streams which bring in the Oxygen-Cash.

  • Own Brand + Own Plant : High reward, but requires a robust sales team and brand-building budget in addition to the Capital Investment towards resources like Land,Building,Equipments etc. Asset Heavy Business Model.
  • Own Brand + Other’s Plant (Co-Packing) : Can be started with a fairly low Capital. Asset Lite Business Model
  • Franchise Model: You leverage an existing brand’s reputation. This reduces marketing effort but involves ongoing royalty fees. This is also an Asset Heavy Business Model.

Step 2: Market Mapping & Regional Pricing

Water is a heavy, “low-value, high-volume” commodity. Your profitability is physically limited by your geography:

  • The 100km Rule: If your primary market is too far from your plant, transport and fuel costs will bleed your margins dry.
  • Price Ceilings: You must map the local “Retail Ceiling.” If your competitors are selling 20L jars at Rs. 30, your “efficient” plant won’t survive if your cost-to-serve is Rs. 28. Cost to Serve is different from COGS.

In our Training, we give emphasis on understanding the “Costing” part in reasonably high details. As most of the failures we have seen is not understanding the Numbers. Somehow entrepreneurs are shy about it. But if you master this, we assure you are 99.99% successful.

Step 3: Define Your Product Mix & SKUs

As we saw in the Ramesh vs. Suresh comparison, your SKU (Stock Keeping Unit) selection is your biggest profit lever.

  • Strategic Balancing: You must decide the ratio of small bottles (for Brand Scale) to 20 Ltr Jars (for Institutional Cash Flow).
  • Flexibility: A profitable plant is one that can quickly shift production from 1L bottles to 200ml variety or 5L jars as seasonal demand or event requirements change. And can also incorporate the 2026 new trend for HORECA : Glass Bottle Line. Flexibility also calls for expanding through new segments as well as new business models like Franchising, B2G etc. We have already explained this in our another post which talks about whether the Packaged Drinking Water Business is still profitable

Step 4: Define Your Total Cost Structure (Direct vs. Indirect)

A common mistake in the mineral water industry is thinking that “Plant Cost” is just the price of the machinery. In reality, the machinery is only the starting point. To evaluate your profit, you must separate your costs into two distinct buckets:

  • Direct (Variable) Costs: These are the costs that move with every bottle produced—PET preforms, labels, caps, consummables, electricity for production, and contract labour (if any) for packing. If you don’t produce, you don’t pay these.
  • Indirect (Fixed) Costs: These are the “silent” profit killers. They stay the same whether you sell 1 bottle or 10,000. This includes FSSAI and BIS compliance costs, factory rent, insurance, administrative salaries, and, most importantly, interest on your capital investment.

Strategic Insight: Your real profit margin is only revealed after these indirect costs are “absorbed” by your sales volume. This is why a plant running at 30% capacity often operates at a loss, even if the “cost per bottle” seems low.

Step 5: Create 3-Year Time-Bound Financial Projections

Profitability in the water business is not a sprint; it’s a marathon. You cannot judge the success of your plant based on the first three months of operation.

  • The 3-Year Horizon: You must create a financial roadmap that accounts for the “Seasonality Factor.” In India, the summer months (March–June) provide peak profits, while the monsoon and winter months see a dip.
  • The Breakeven Point: Your projections must clearly show when the “accumulated profit” will finally cover your initial investment (ROI).
  • Weighted Averages: Instead of looking at a “good month,” calculate your Annual Weighted Average Profit. This gives you a realistic picture of your business’s health across all 12 months.

Conclusion: The High Cost of Poor Planning

Calculating a profit margin is far more than a mathematical exercise—it is a strategic necessity. Industry data suggests that nearly 50% of mineral water units close down within their first few years. In my experience, these failures are rarely due to a lack of demand or intense competition.

They fail because the owners started with a “wrong calculation basis.” They chased volume instead of value, ignored indirect costs, or failed to balance their SKU portfolio.

Take a conscious, data-driven decision before you invest your hard-earned capital.

Need Professional Financial Clarity?

If you want to move beyond “rough estimates” and see the actual numbers for your specific location and business model, join our next Live Online Training. We dedicate specialized sessions to CAPEX & OPEX modeling, helping you build a plant that isn’t just operational, but sustainably profitable.

FAQ’s

Why is a high daily turnover not always a guarantee of high profit?

As shown in the comparison between “Ramesh” (volume-focused) and “Suresh” (value-focused), a high turnover often comes from selling small bottles. These require high recurring costs for PET preforms, labels, and caps. A business with lower turnover but a focus on returnable 20-liter jars can actually have a higher profit margin because the packaging is a reusable asset rather than a daily expense.

What is the “100km Rule” in the mineral water business?

Water is a heavy, low-value commodity, meaning transportation costs can quickly consume your margins. The “100km Rule” suggests that your primary market should ideally be within a 100km radius of your plant. Beyond this distance, the cost of fuel and vehicle maintenance often makes the business unsustainable unless you have a premium pricing strategy.

How does the product mix (SKUs) affect my working capital?

Your choice of SKUs (Stock Keeping Units) directly impacts your cash flow.
Small Bottles: Build brand identity but require large amounts of working capital to constantly repurchase raw materials (bottles/caps).
20 Liter Jars: Act as “Cash Flow Drivers.” Since they are returnable, your primary recurring costs are just the water treatment, labor, and the cap, which keeps your daily cash outflow much lower.

What is the difference between Direct and Indirect costs in a water plant?

To calculate true profit, you must distinguish between:
Direct (Variable) Costs: Costs that change based on production volume, such as preforms, chemicals, electricity for machines, and labels.
Indirect (Fixed) Costs: “Silent profit killers” that you pay regardless of sales volume. These include FSSAI/BIS compliance fees, factory rent, administrative salaries, and interest on bank loans. A plant is only truly profitable after these indirect costs are fully covered by sales.

Why should I create a 3-year financial projection instead of a monthly one?

The mineral water business is highly seasonal. In regions like India, demand peaks during the summer (March–June) and dips during the monsoon and winter. A 3-year projection allows you to calculate an Annual Weighted Average Profit, accounting for these fluctuations and helping you identify the exact “Breakeven Point” where your accumulated profits finally cover your initial capital investment.